Tutorials
SMG2S Example
Include header file
#include <smg2s/smg2s.h>Generate the Nilpotent Matrix for operation :
Nilpotency<int> nilp;
nilp.NilpType1(length,probSize);
After that, you need to create the parallel Sparse Matrix Object Mt like this :
parMatrixSparse<std::complex<float>,int> *Mt;And now, you can generate a new matrix :
MPI_Comm comm;
Mt = smg2s<std::complex<float>,int>(probSize, nilp, lbandwidth, spectrum, comm);
Here, the probsize parameter represent the matrix size, nilp is the nilpotency that we have declared previously, lbandwidth is the number of diagonal band. spectrum is the file path of spectra file. comm is the basic object used by MPI to determine which processes are involved in a communication.
Reminder : The given spectra file is in pseudo-Matrix Market Vector format.
Graphic User Interface for Verification
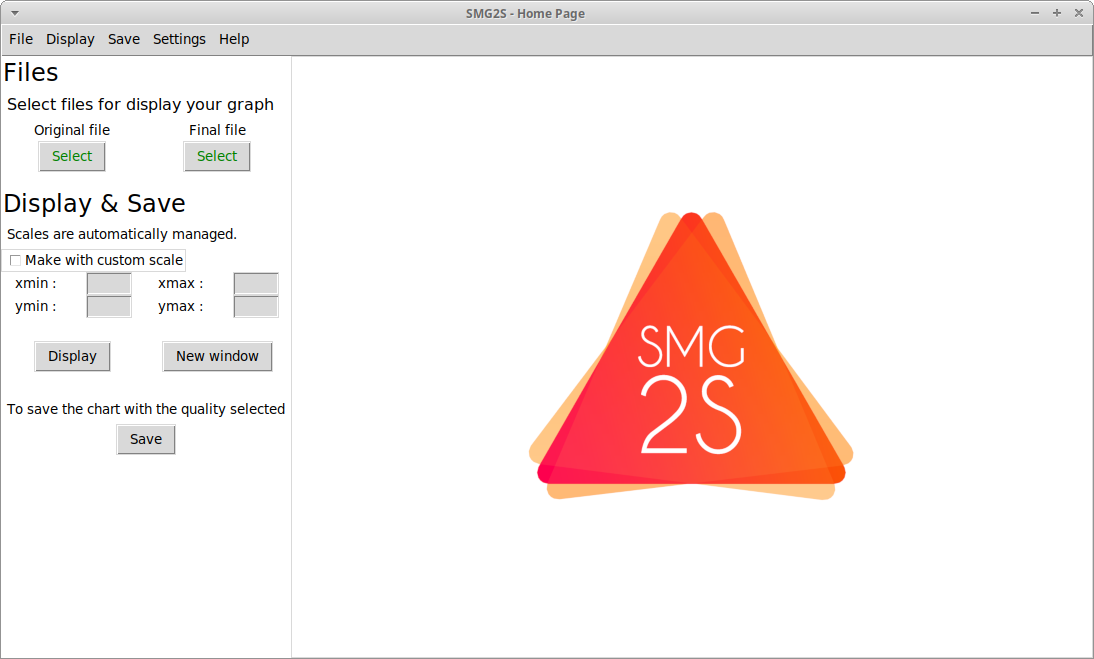
When you launch the program, a new windows opens like this :

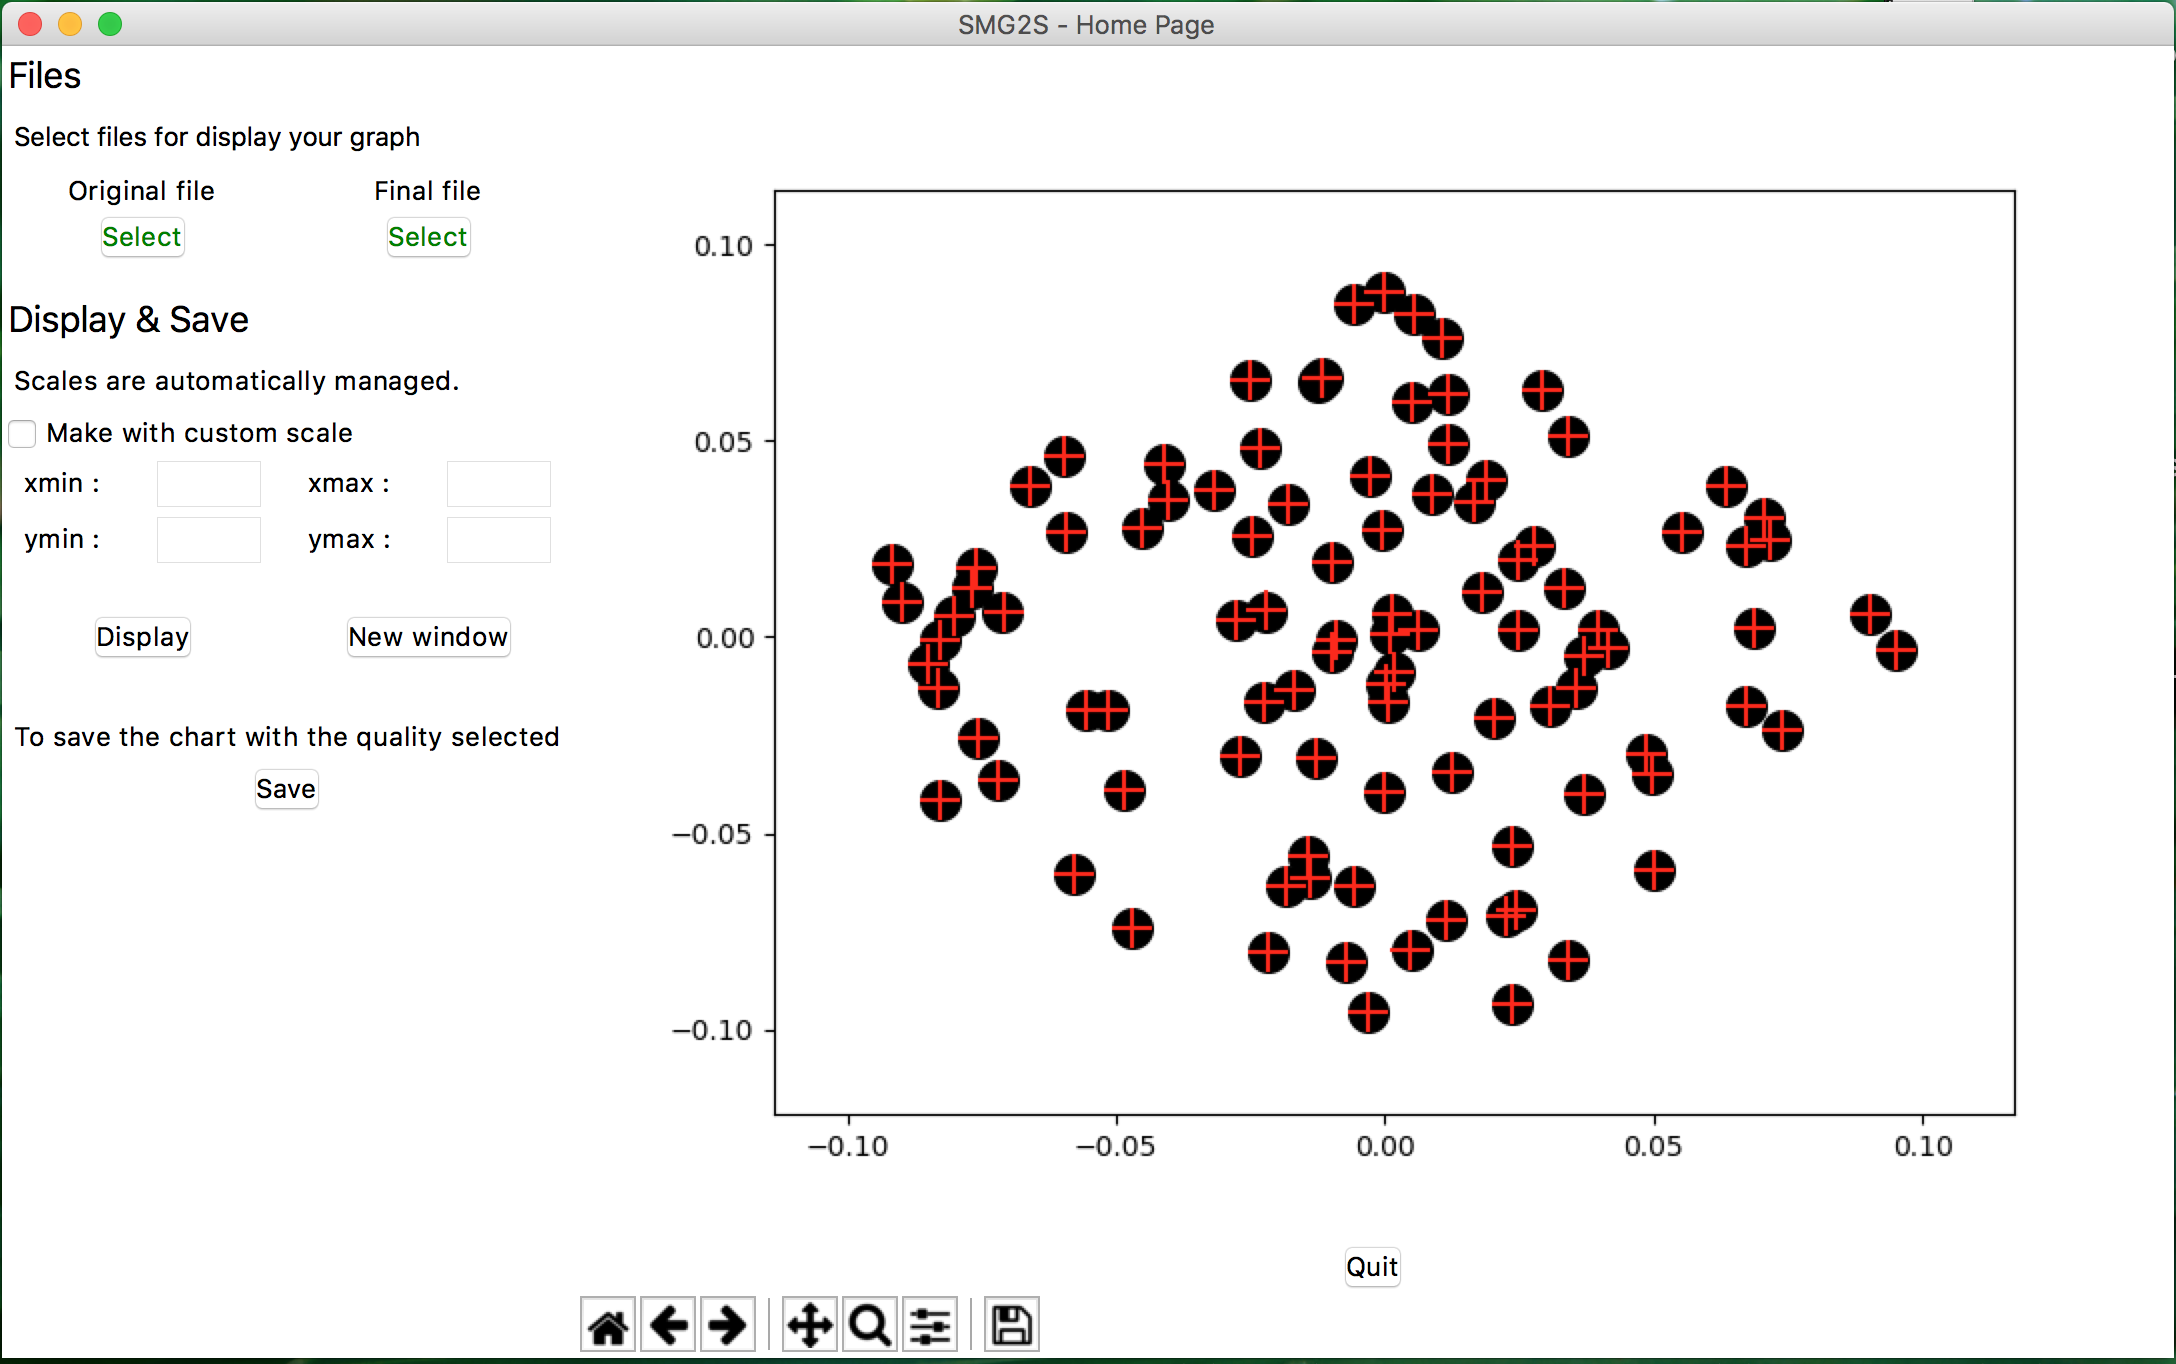
The first step is to select the files which be display When you have selected a file, the button change in green color :

After that, you can click on "Display" to build and open the graphic on the right side of the window. Click on "New window" to open your graphic on a new window. It's possible to open as many windows as you want.

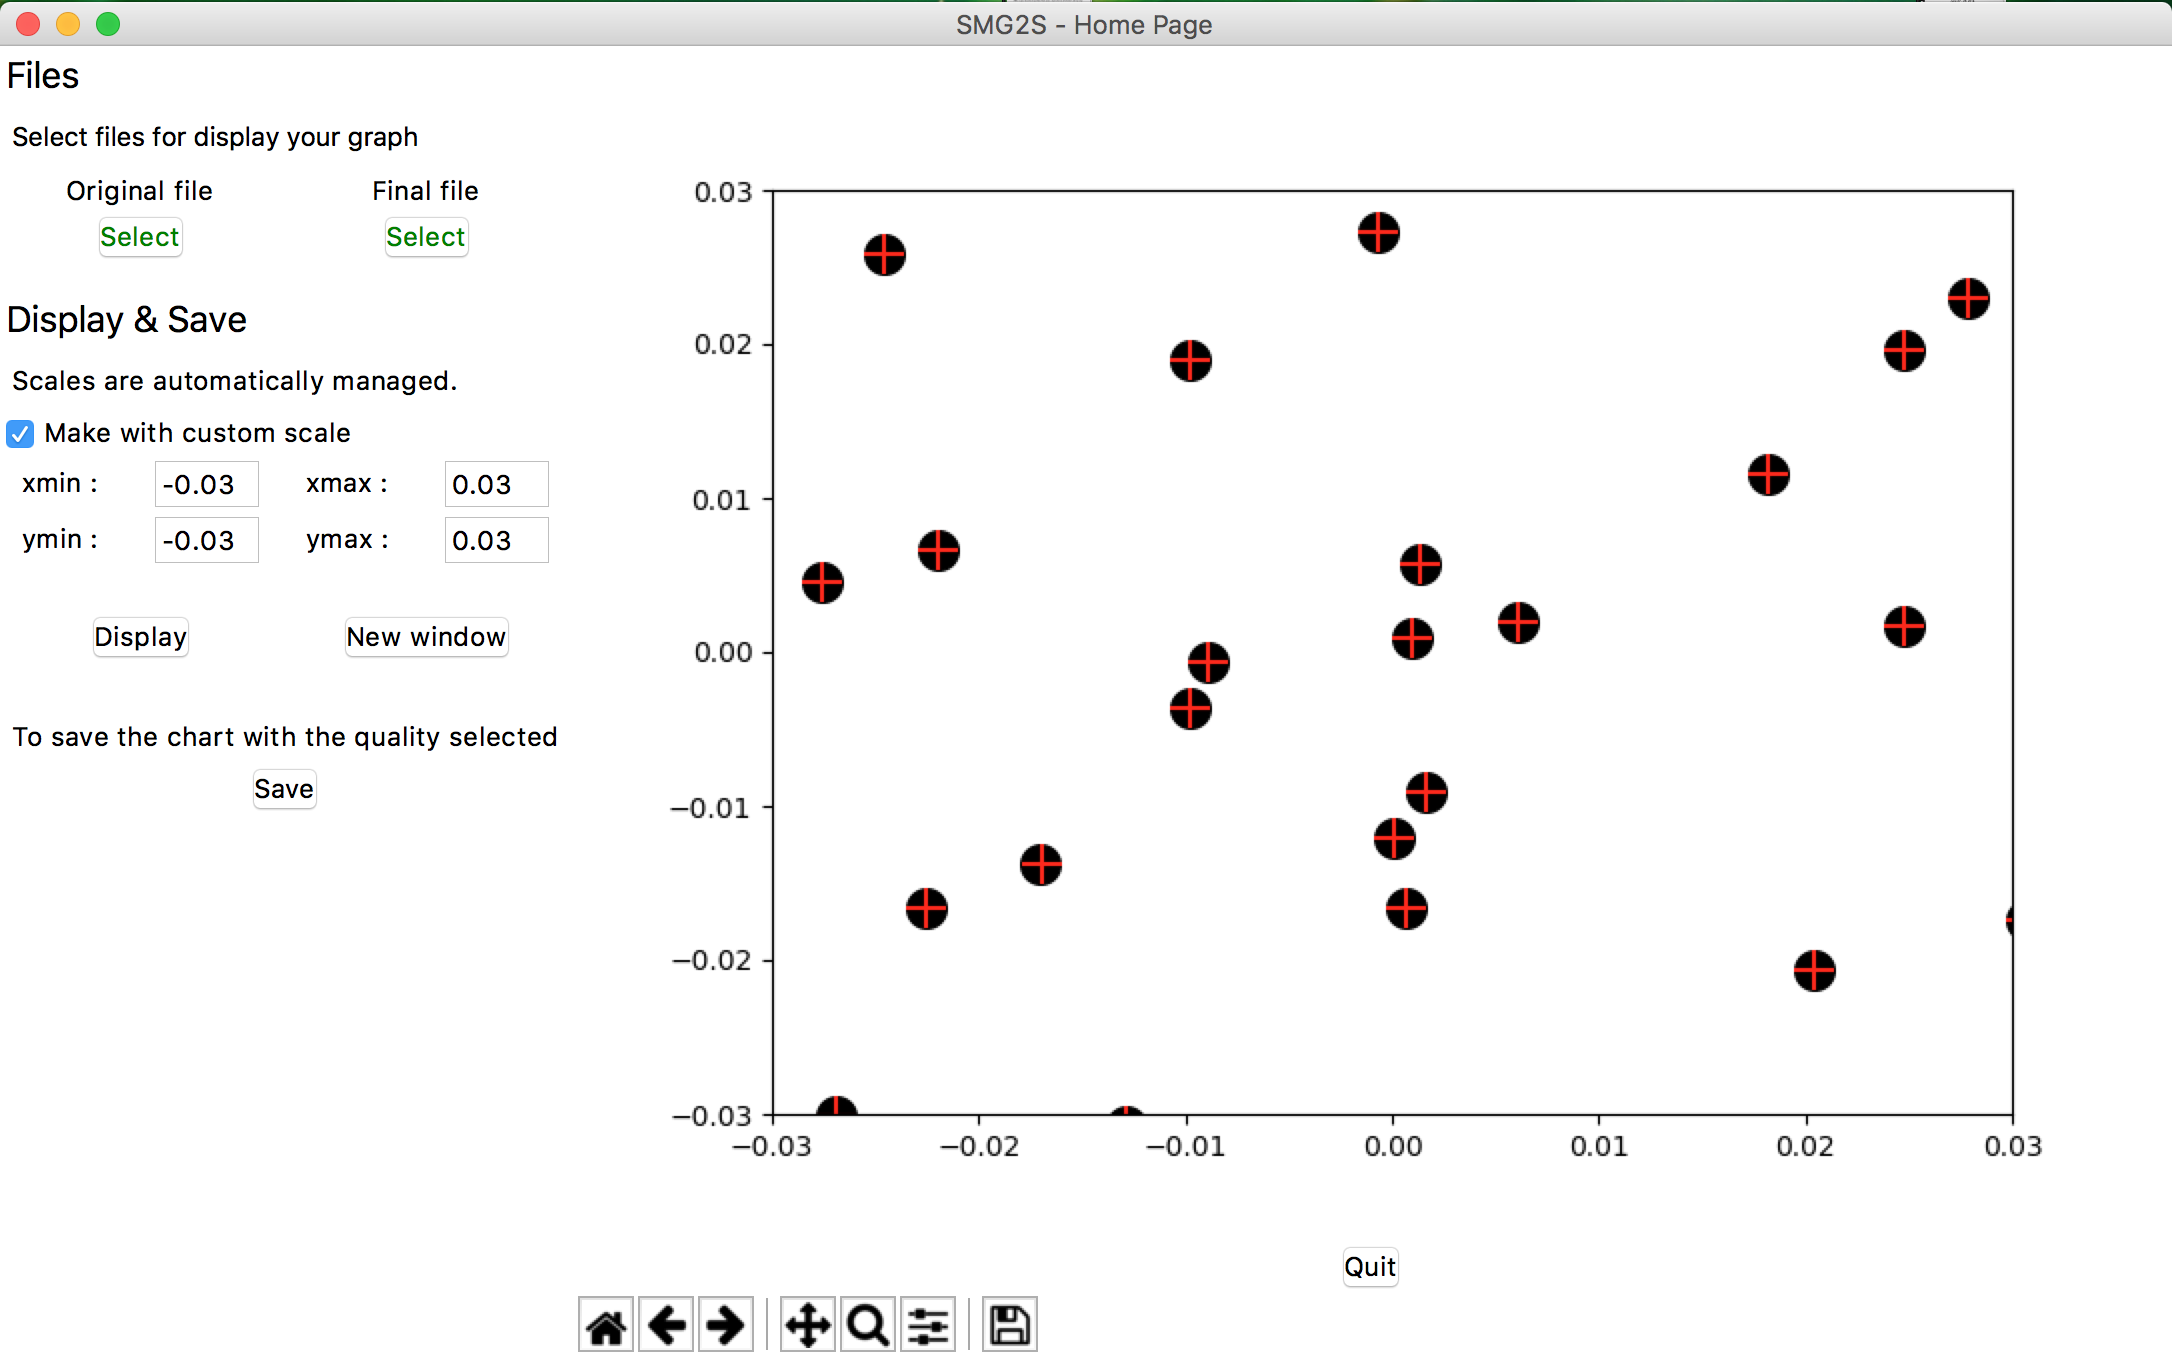
Your will be generate with automatic lens scaling, but your can generate it with your own scales.

You can save the graphic with will be generate with your settings. For that, click in the button "Save" on the left of the main window. You can change the saved chart resolution on Settings->Canvas on the navbar.

Advanced use
When your graphic is displayed, a function bar is created.

How to use this bar ?
The home icon  permit to reset the original graphic which be generate. The left
  and right
  buttons permit to undo and redo graphic when you change it dynamically. If you click on the directional pad icon
  , you can pan with left mouse and zoom and dezoom with right mouse. You must click again to disable this feature. When you click on the magnifying glass icon
  , you can holding down the left or right mouse and select a rectangle on the graphic to respectively zoom or dezoom on the graph. Like with the directionnal pad, you need to click to disable this feature. When your mouse pointer is not on the graphic, you will see in the bottom right if one of this features are enabled. The settings icon
  permit to configurate your graphic. The last one icon
  permit to save what you see on the screen (with the same resolution).